Note: phiên bản Tiếng Việt của bài này ở link dưới.
https://duongnt.com/structured-log-vie
What is structured logging
In my opinion, logging is one of the most powerful tools that a developer can depend on. Without it, tasks like debugging, status monitoring or profiling would be vastly more difficult, if not outright impossible. This is even more true when we consider a big system with many microservices working in tandem, many of those are themselves duplicated for availability.
Traditional logging
The traditional way to log information is to write all data as text into files. This approach, however, has a big shortcoming. It throws away invaluable context about the original message. Let us consider a very big log file which contains messages with the following two patterns.
<timestamp> Warn: CPU Usage percentage exceeded 50% for node A
<timestamp> Warn: Memory Usage exceeded 50% for node B
We can run some filters like grep %node A% to retrieve all messages about NodeA, or we can use grep %exceeded 50% to find all warnings when any node consumes more than 50% of its resource. With some clever hack, we might even get some specific information like CPU usage of node A exceeded 50%. However, this is a clunky and time-consuming process, which is also prone to errors.
Structured logging
In structured logging, instead of storing everything as plain text, log messages are formatted and stored in a predefined format. The two messages in the previous section will become this.
{
   "Timestamp":"<timestamp>",
   "Level":"Warning",
   "MessageTemplate":"{ResourceName} percentage exceeded {ResourcePercentage}% for node {NodeName}",
   "Properties":{
      "ResourceName":"CPU Usage",
      "ResourcePercentage": 50,
      "NodeName": "A"
   }
},
{
   "Timestamp":"<timestamp>",
   "Level":"Warning",
   "MessageTemplate":"{ResourceName} percentage exceeded {ResourcePercentage}% for node {NodeName}",
   "Properties":{
      "ResourceName":"Memory Usage",
      "ResourcePercentage": 50,
      "NodeName": "B"
   }
}
With structured logging, we can query data very easily. For example: to find all warnings for node A where its CPU Usage exceeds 50%, we can simply write this query NodeName = A and ResourceName = "CPU Usage" and ResourcePercentage > 50. And because our logs have a fix format, they are also machine-readable. We can use all kinds of third-party tools to read, analyze and find patterns from them.
Structured logging with Seq
To fully demonstrate the power of structured logging, we will use a centralized log system called Seq. You can download and install a trial version of Seq from here. There are also other providers like SumoLogic or Datadog.
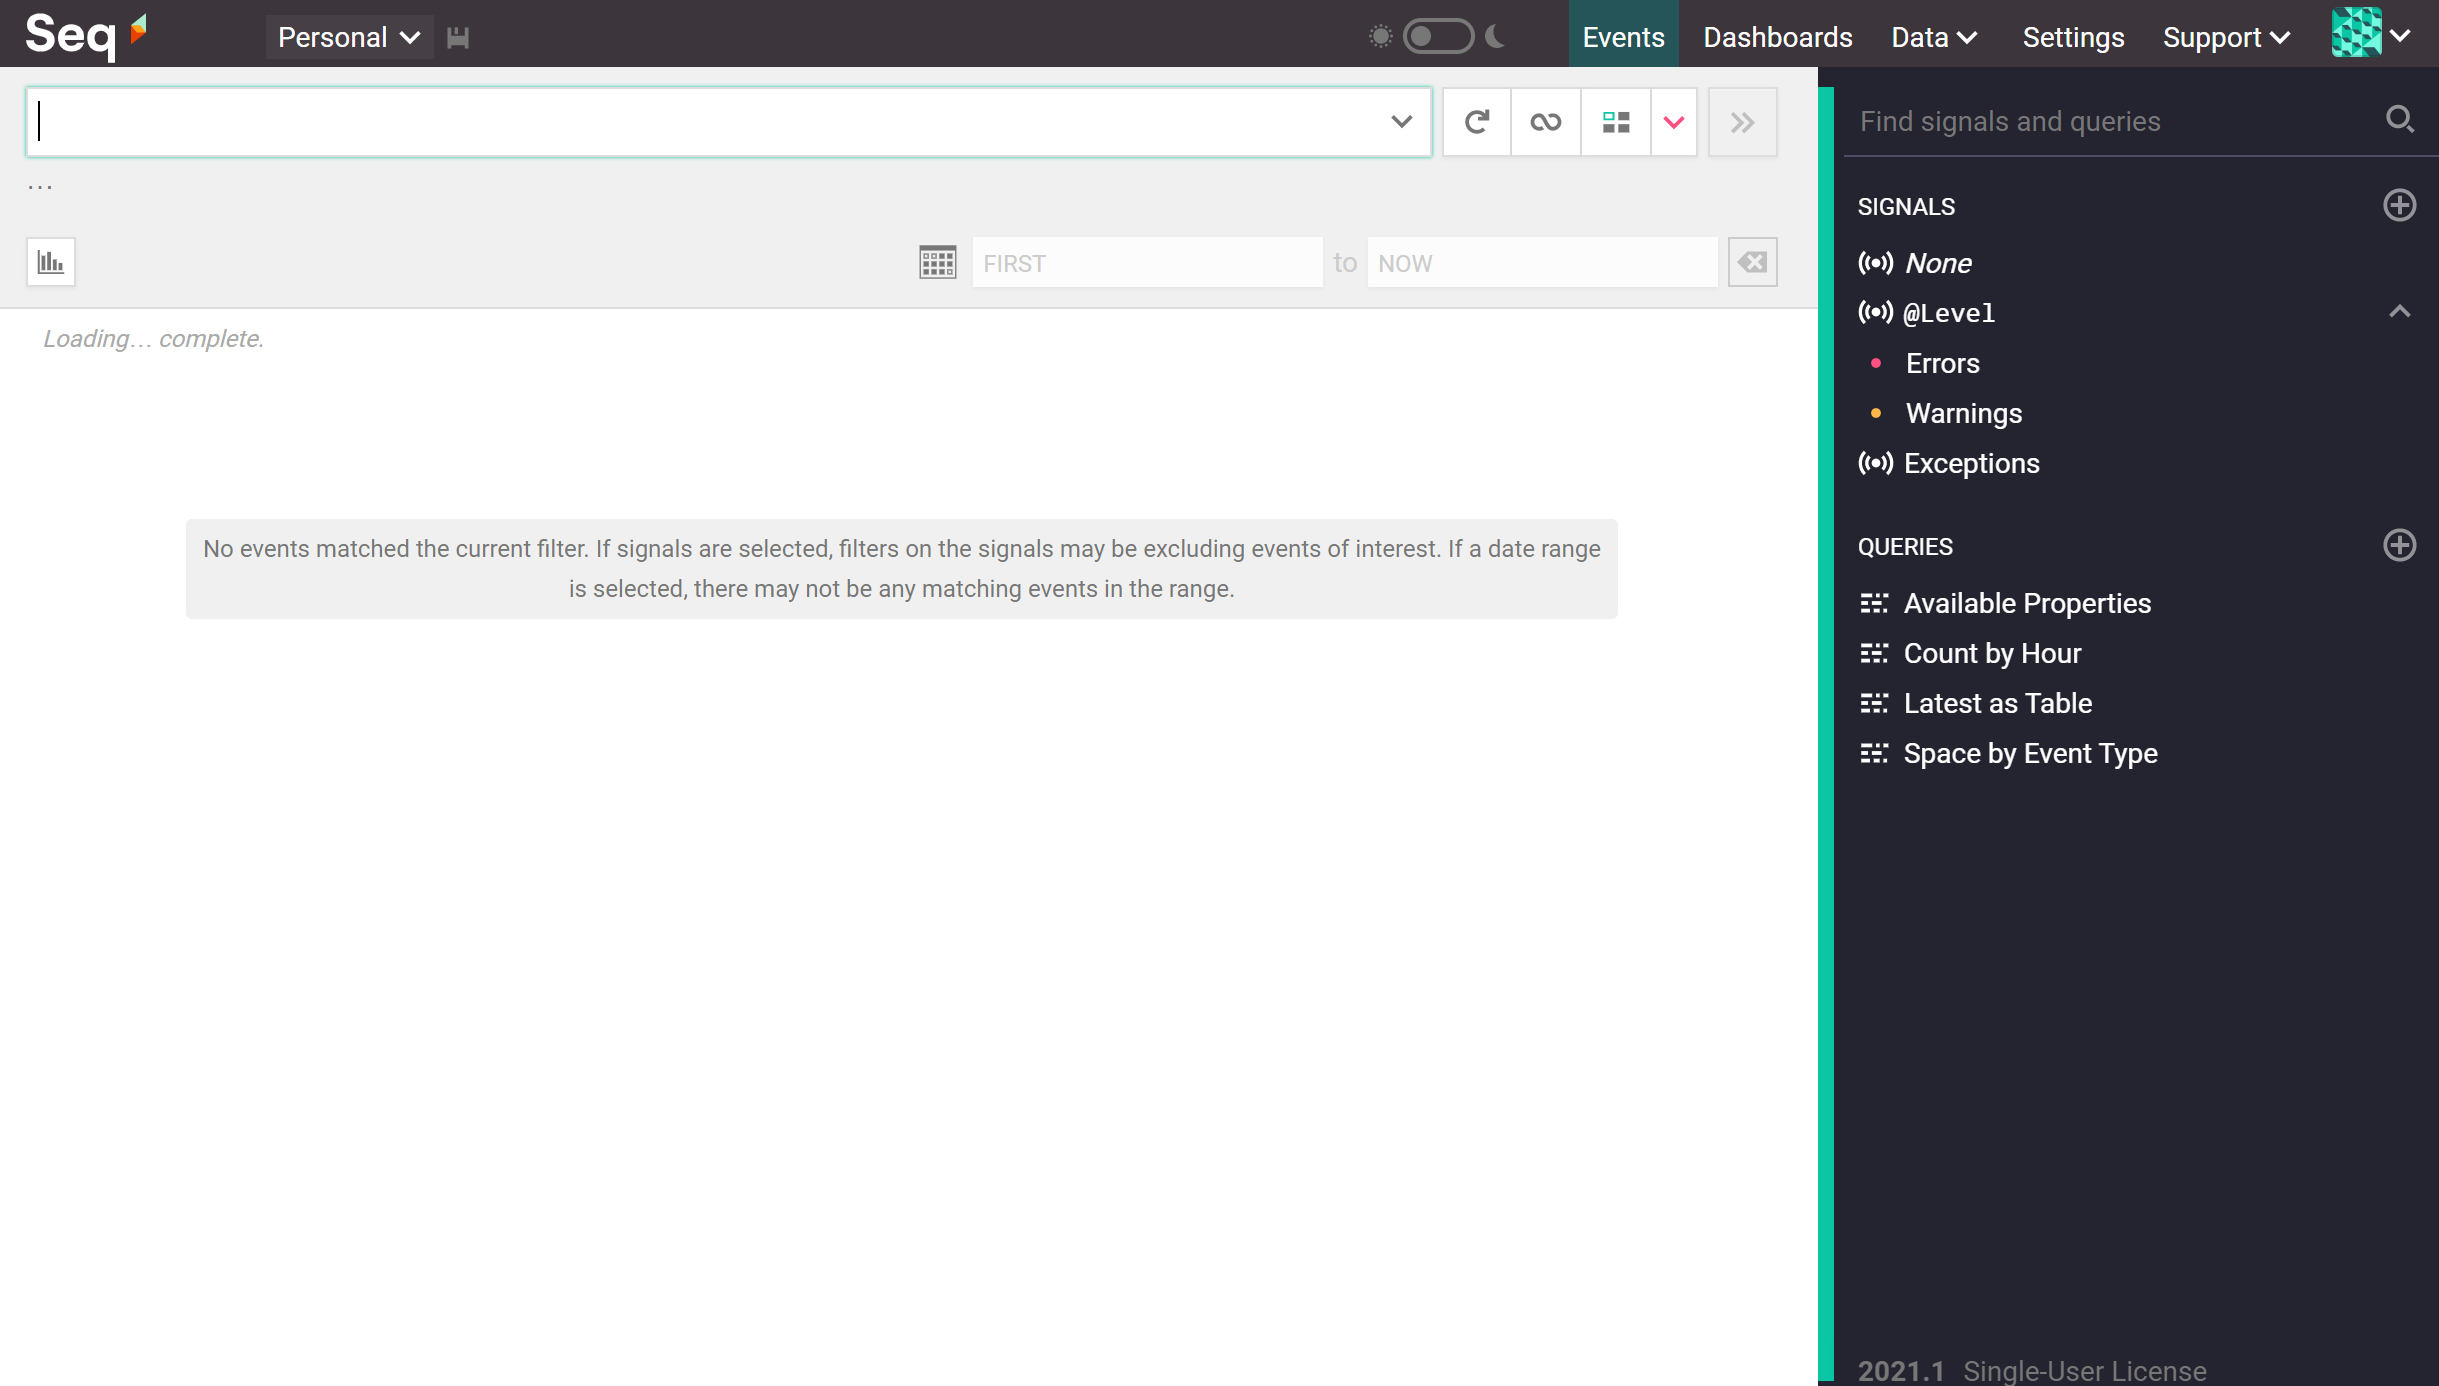
After installing, Seq will run on port 5341 by default. Its home page is below.

I’ve also prepared a log generator, you can grab it here. You can simply clone this repository and run this command to create some log messages for demonstration.
dotnet run Seq
You should then see all the generated logs like this.

Note that even though we are using structured logging, Seq hides all those details and presents the messages the same way as traditional logging.
Now let’s run some simple query.
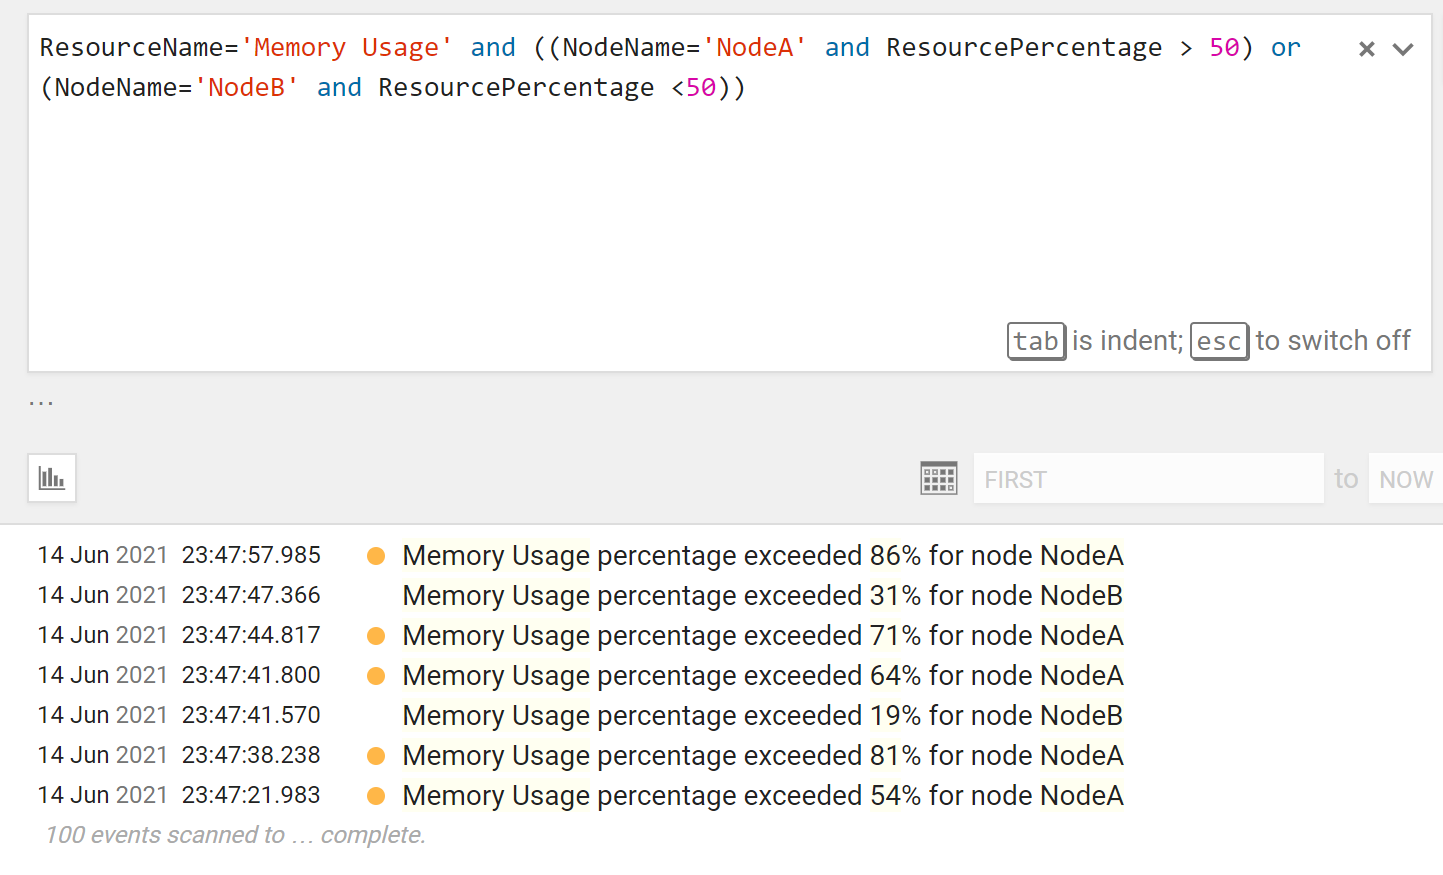
Retrieve all messages for NodeA where Memory Usage is higher than 50% and all messages for NodeB where Memory Usage is lower than 50%.
ResourceName='Memory Usage' and ((NodeName='NodeA' and ResourcePercentage > 50) or (NodeName='NodeB' and ResourcePercentage <50))

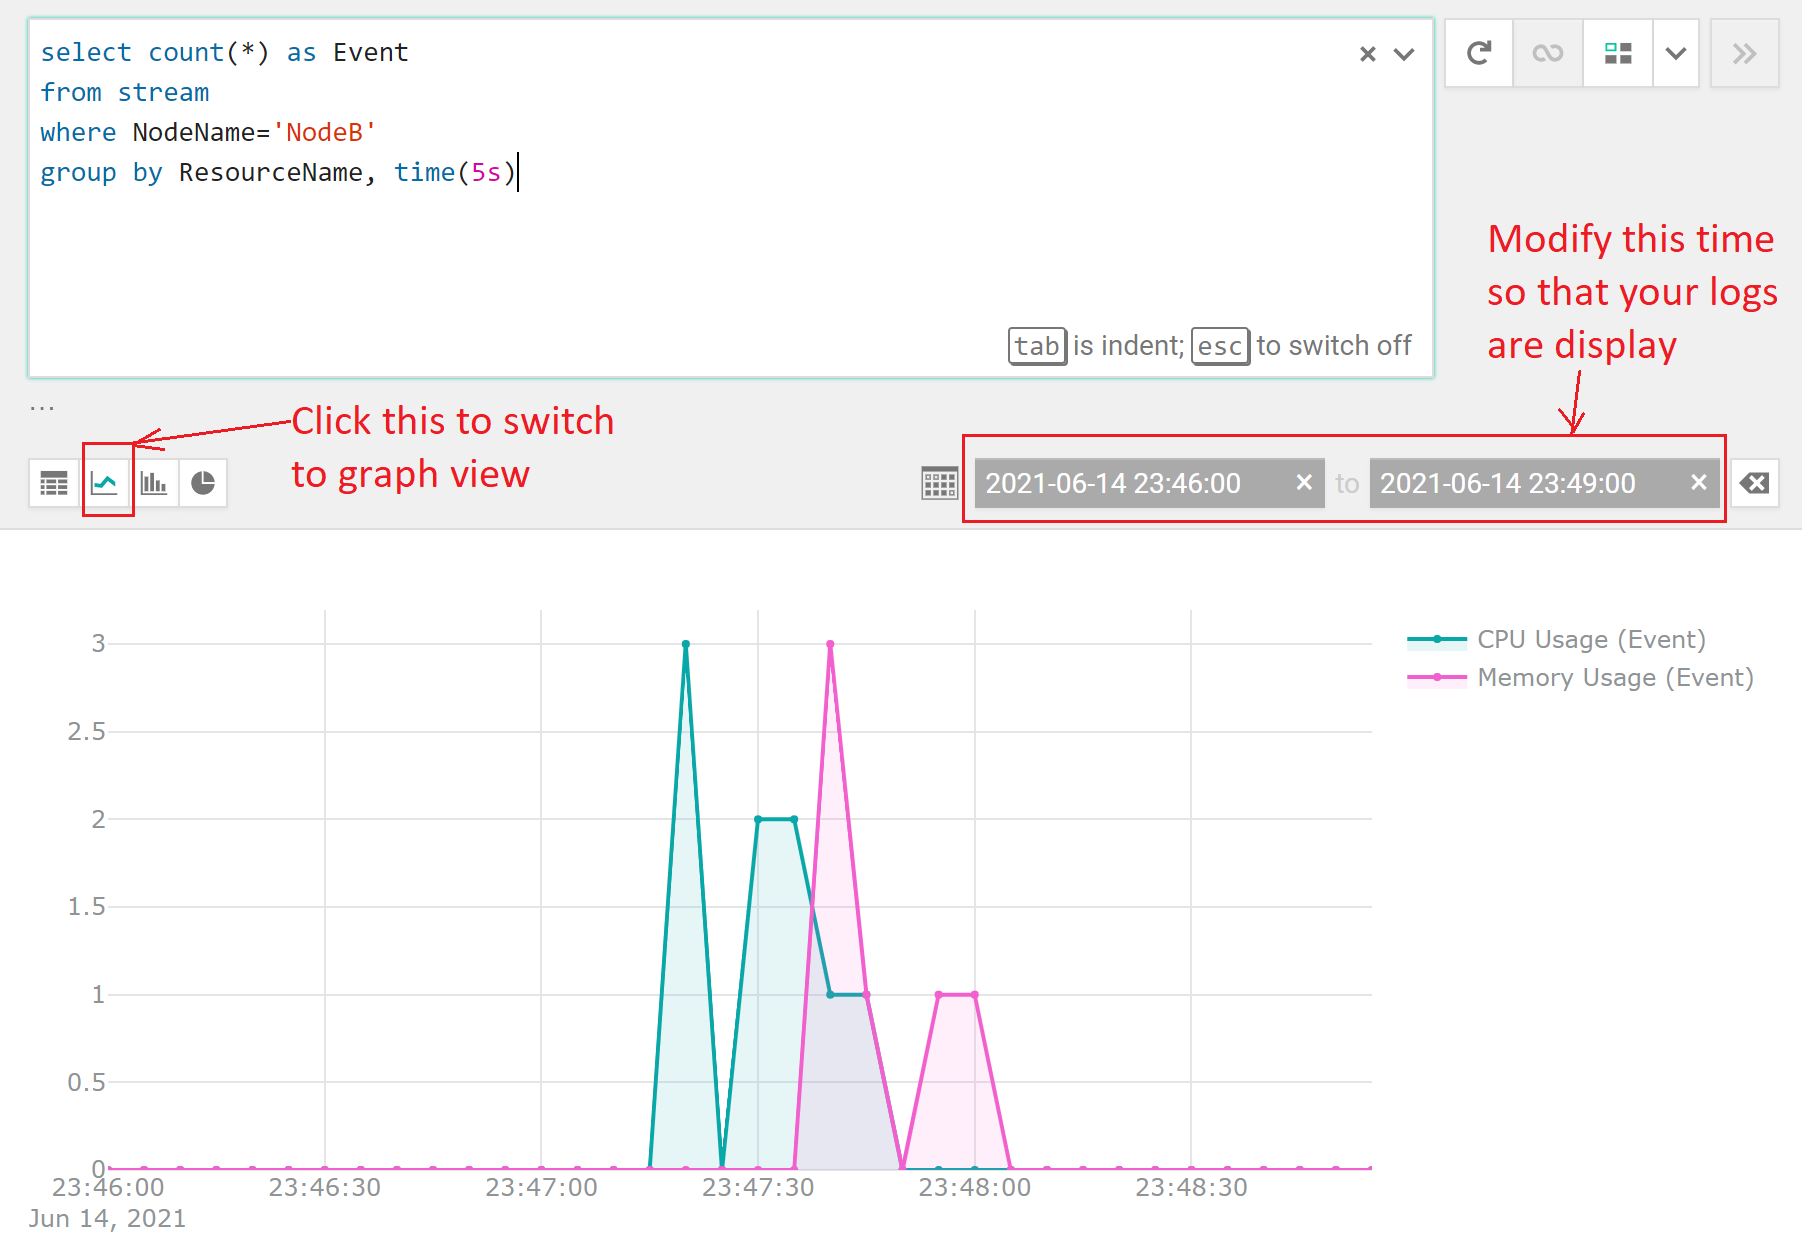
Draw a graph for events of NodeB, grouping by type of resource, so that we can see the correlation between high CPU usage and high memory usage.
select count(*) as Event
from stream
where NodeName='NodeB'
group by ResourceName, time(5s)

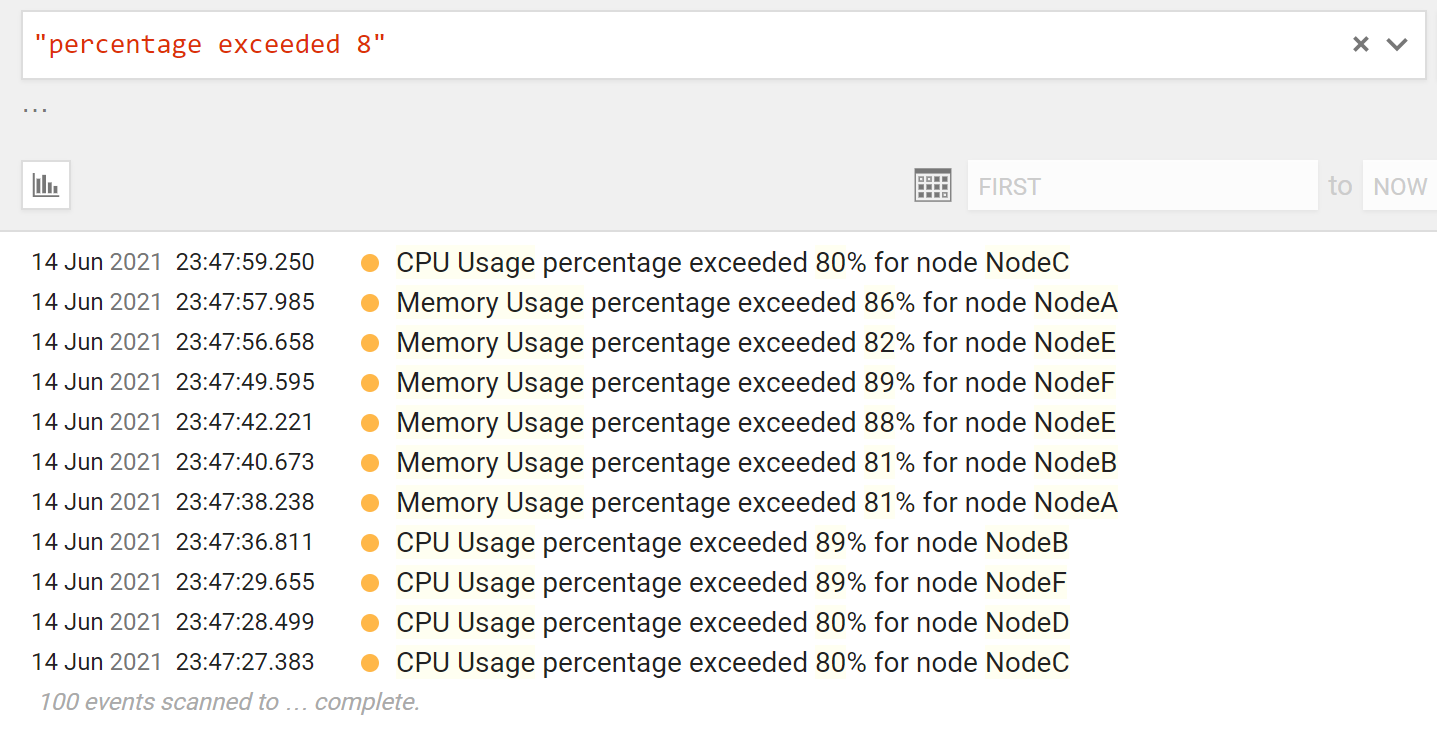
Also, you don’t have to filter based on log parameter, filter based on log text still works like in traditional logging.
"percentage exceeded 8"

Structured logging in C# with Serilog
We will use Serilog to write structured log in C#, but there are also libraries like NLog or Microsoft.Extensions.Logging…
Install necessary libraries
First, we need to install Serilog.
dotnet add package Serilog --version 2.10.0
Then we will install the extension to integrate Serilog with .Net Core logging pipeline.
dotnet add package Serilog.Extensions.Hosting --version 4.1.2
We also need to install sink, which is the target where we write our logs. In a production environment, we would use a centralized log system like Seq, but we will add two more sinks here for debug purposes, one to write log to console and another to write log to file.
dotnet add package Serilog.Sinks.Seq --version 5.0.1 // <- Seq sink
dotnet add package Serilog.Sinks.File --version 4.1.0 // <- File sink
dotnet add package Serilog.Sinks.Console --version 3.1.1 // <- Console sink
Setup Serilog
Create a LoggerConfiguration and set it to write to the Seq instant we set up in the Structured logging with Seq section.
var configuration = new LoggerConfiguration();
configuration.WriteTo.Seq("http://localhost:5341/"); // <- use default port of Seq
Use the new LoggerConfiguration to create a Logger instance and assign it to the globally-shared ILogger instance of Serilog.
Log.Logger = configuration.CreateLogger();
Then we need to add Serilog to the logging pipeline of .Net Core.
services.AddLogging(logBuilder => logBuilder.AddSerilog(dispose: true))
After that we can start using Serilog.
_logger.Log(LogLevel.Information, "Hello to {Name}", "Nguyen Thai Duong");
Which will output this log message.

And structurally equals this (time is UTC).
{
   "@t":"2021-06-15T13:43:26.3719578Z",
   "@mt":"Hello to {Name}",
   "@m":"Hello to Nguyen Thai Duong",
   "@i":"8a4e9e4c",
   "Name":"Nguyen Thai Duong",
   "SourceContext":"StructuredLogGenerator.LogGenerator"
}
Write log to file or console
A centralized log system is the best sink for structured logging most of the time, but sometimes we need to export log to file or write to console for debug purposes.
To write to the console, change LoggerConfiguration to this.
var configuration = new LoggerConfiguration();
configuration.WriteTo.Console(); // <- use console as log sink
Then the result of this.
_logger.Log(LogLevel.Information, "Hello to {Name}", "Nguyen Thai Duong");
Will become this.

We can also format console output as JSON.
var configuration = new LoggerConfiguration();
configuration.WriteTo.Console(new JsonFormatter()); // <- use formatter here

Similarly, to export logs to file, we change LoggerConfiguration to this.
var configuration = new LoggerConfiguration();
configuration.WriteTo.File("C:/duong.log"); // <- write logs to "C:/duong.log"
You can probably guess that we can also format log to JSON format in this case.
var configuration = new LoggerConfiguration();
configuration.WriteTo.File(new JsonFormatter(), "C:/duong.log");
Conclusion
What I covered in this article is just the very tip of structured logging and its features. Use it instead of traditional log and your future self will thank you when you have to debug a tricky issue. I know I did.
One Thought on “Structured logging in C#”